Consolidated
Financial
Highlights
| IFRS | |||||
|---|---|---|---|---|---|
| 3/2019 | 3/2020 | 3/2021 | 3/2022 | 3/2023 | |
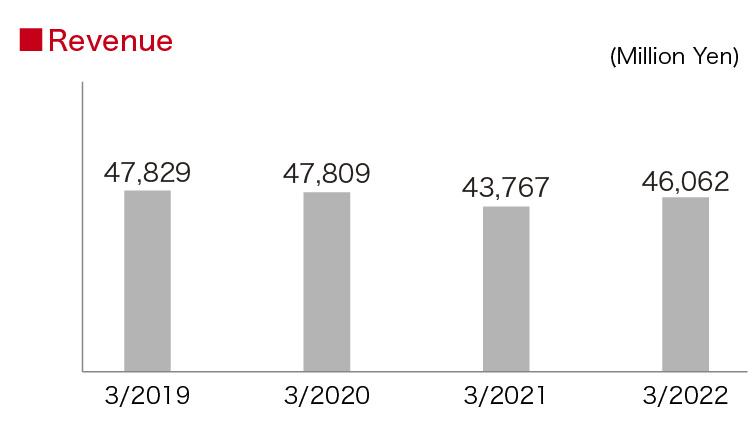
Revenue(Million Yen) |
47,829 | 47,809 | 43,767 | 46,062 | 58,347 |
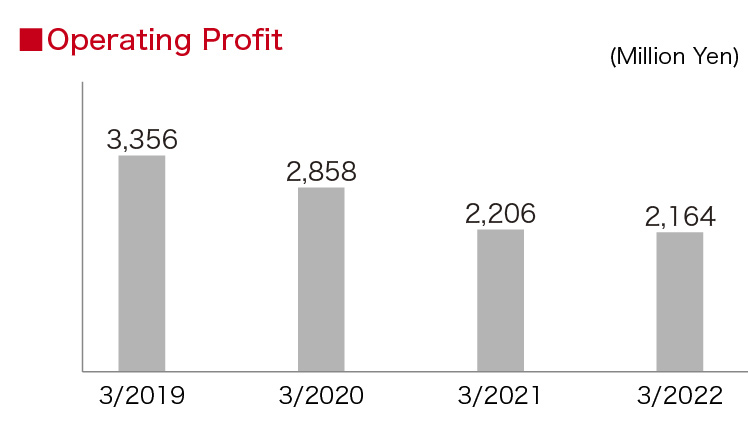
Operating Profit(Million Yen) |
3,356 | 2,858 | 2,206 | 2,164 | 1,606 |
Ratio of Operating Profit to Revenue(%) |
7.0 | 6.0 | 5.0 | 4.7 | 2.8 |
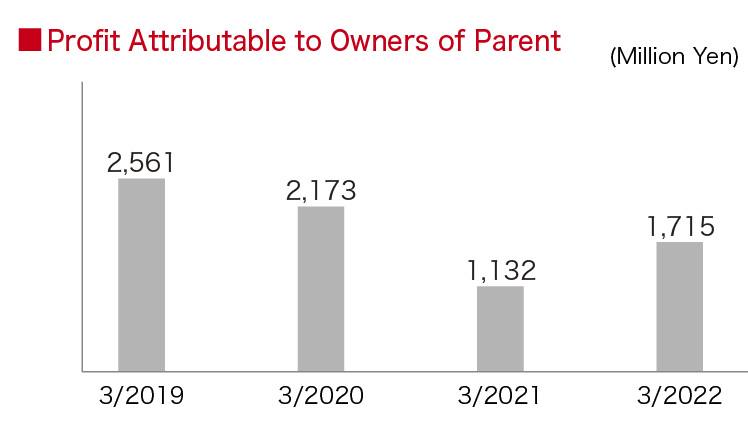
Profit Attributable to Owners of Parent(Million Yen) |
2,561 | 2,173 | 1,132 | 1,715 | 1,062 |
Return on Equity Attributable to Owners of Parent(%) |
5.4 | 4.5 | 2.3 | 3.5 | 1.8 |
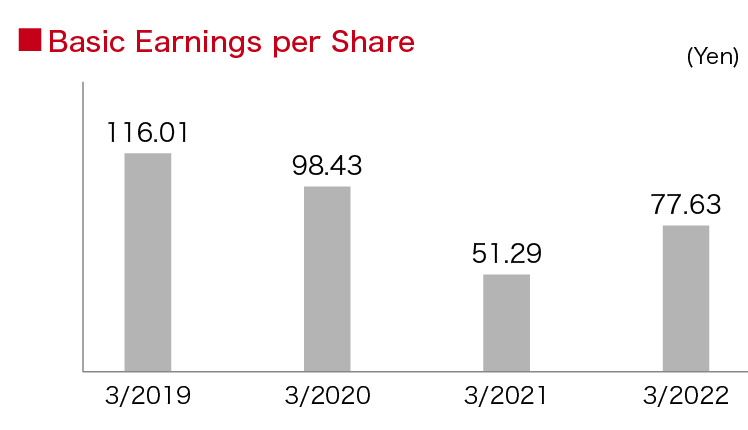
Basic Earnings per Share(Yen) |
116.01 | 98.43 | 51.29 | 77.63 | 43.26 |
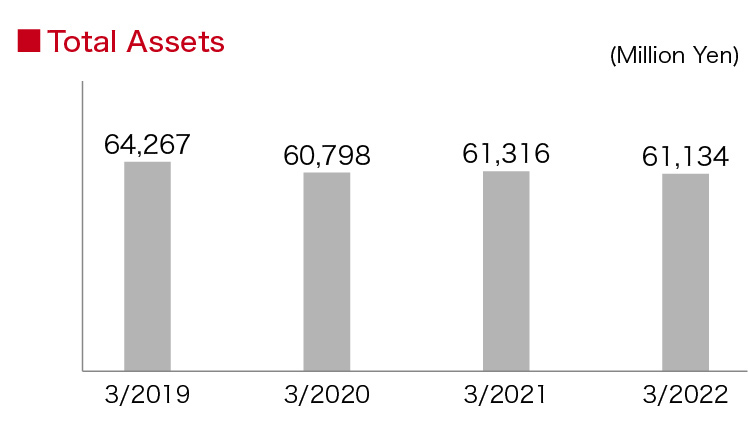
Total Assets(Million Yen) |
64,267 | 60,798 | 61,316 | 61,134 | 93,572 |
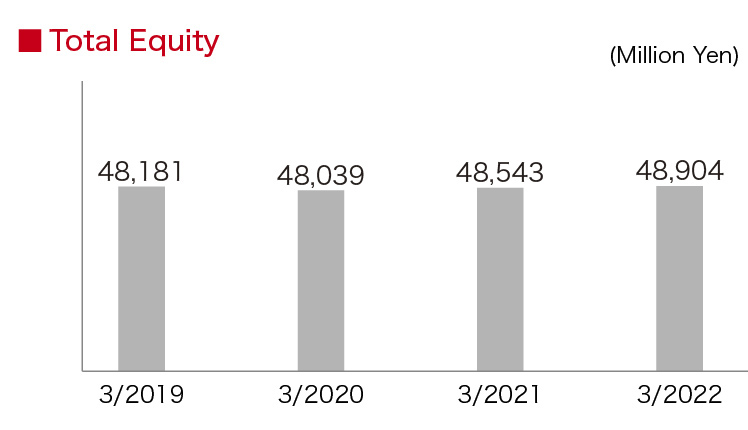
Total Equity(Million Yen) |
48,181 | 48,039 | 48,543 | 48,904 | 68,264 |
Ratio of Equity Attributable to Owners of Parent to Total Assets(%) |
75.0 | 79.0 | 79.2 | 80.0 | 73.0 |
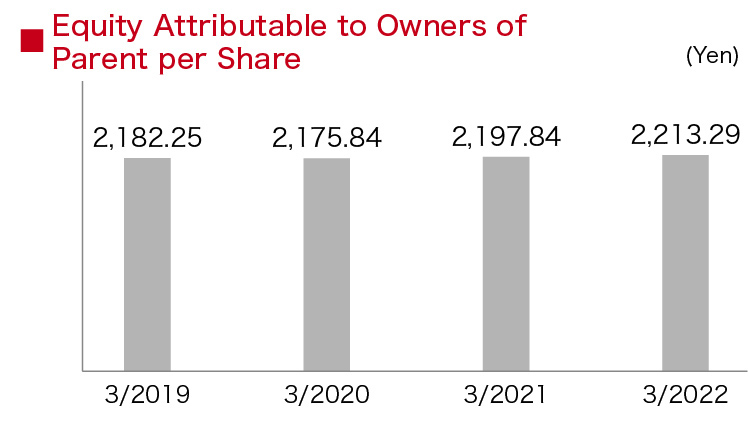
Equity Attributable to Owners of Parent per Share(Yen) |
2,182.25 | 2,175.84 | 2,197.84 | 2,213.29 | 2,083.71 |
Cash Flows from Operating Activities(Million Yen) |
4,814 | 3,972 | 3,319 | 2,178 | (1,625) |
Cash Flows from Investing Activities(Million Yen) |
(3,607) | (2,185) | (482) | (651) | 4,609 |
Cash Flows from Financing Activities(Million Yen) |
(2,386) | (2,505) | (2,398) | (2,402) | (3,684) |
Cash and Cash Equivalents at the End of the Year(Million Yen) |
8,803 | 8,085 | 8,524 | 7,649 | 11,263 |